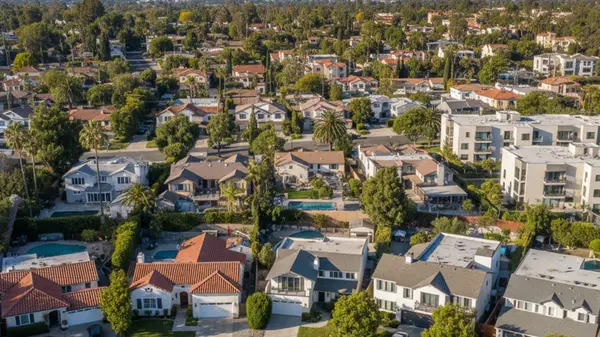
Anaheim Market Update - February 2026
Anaheim’s February 2026 market combined tight supply and fast sales with softer overall activity. Inventory remained limited with 174 active listings (-1.1%) and 2.0 months supply (+5.3%), while homes averaged 17 days active in MLS (-19.0%) and sold at 100.0% of last list price (-0.2%). At the same time, demand measures eased with pending sales at 54 (-31.6%) and closed volume at $110,857,200 (-8.6%), while prices stayed relatively steady with a $884,000 median (-0.3%) and a $866,072 average (-2.9%).
Complete Market Statistics
Supply Metrics
Demand Metrics
Showing Activity
Pricing Metrics
Market Timing
What This Means for Sellers
Opportunities
- Lightning-fast sales - properties selling in 17 days (-19.0% from the previous period), among the fastest in the market.
- Strong pricing power - getting 100.0% of asking price on average (-0.2%).
- Minimal price reductions - only a 0.5% discount from original to final price (99.5% of original price; -0.5%).
- Increased buyer interest - shows per listing increased 62.5% to 7.8.
- Tight inventory - 2.0 months supply (+5.3%), well below the 6-month balanced market threshold.
- Prices holding relatively steady - median price at $884,000 (-0.3%).
Challenges
- Market cooling signs - new listings at 98 (-16.2%) and pending sales at 54 (-31.6%).
- Lower transaction volume - closed volume at $110,857,200 (-8.6%).
- Slight price softening - average price at $866,072 (-2.9%), a larger decline than the median.
Seller Strategy
- Pricing relative to recent comparable sales can matter more when pending sales are down 31.6%.
- Showing patterns indicate around 7 to 8 showings per listing on average (7.8, +62.5%).
- Typical timing remains fast, with 17 days active in MLS (-19.0%).
- Overpricing can increase the risk of extended market time even in a low-supply environment.
- With new listings down 16.2%, listing activity appears more constrained than earlier periods.
What This Means for Buyers
Challenges
- Fast market pace - homes averaged 17 days active in MLS (-19.0%).
- Limited negotiation room - 100.0% of last list price on average (-0.2%).
- More competition per property - shows per listing at 7.8 (+62.5%).
- Tight inventory - 2.0 months supply (+5.3%).
- More shopping before contract - shows to contract at 6.0 (+20.0%).
Opportunities
- Reduced pending activity - pending sales at 54 (-31.6%) indicates softer overall demand than earlier periods.
- Stable median pricing - median sales price at $884,000 (-0.3%).
- Lower transaction volume - closed volume at $110,857,200 (-8.6%).
- Active listings nearly flat - active listings at 174 (-1.1%).
Buyer Strategy
- Given 17 days active in MLS, preparation can help shorten decision timelines.
- List-to-sale metrics suggest offers often align closely with list price (100.0% of last list price).
- Expect multiple showings before finding the right fit, with shows to contract at 6.0 (+20.0%).
- Newer listings can draw attention quickly when shows per listing are elevated (7.8, +62.5%).
- With 2.0 months supply, availability remains limited relative to a balanced market.
Market Outlook
February 2026 conditions in Anaheim reflected a low-supply environment alongside softer demand indicators. Inventory remained limited (2.0 months supply, +5.3%) and sale timelines stayed very short (17 days active in MLS, -19.0%), while pending sales (54, -31.6%) and closed volume ($110,857,200, -8.6%) pointed to reduced overall activity. Pricing was relatively steady at the median ($884,000, -0.3%), while the average price ($866,072, -2.9%) moved down more.
The combination of faster market time and higher showing activity (7.8 shows per listing, +62.5%) suggests that well-positioned homes can still attract strong attention, even as broader transaction measures ease. Differences between metrics may indicate that buyer demand is more concentrated in certain listings and price points.
Categories
Recent Posts