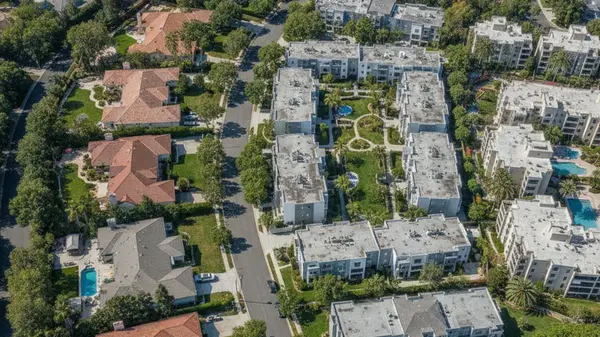
Irvine Market Update - February 2026
Irvine’s February 2026 market reflected a shift toward more supply and slower buyer follow-through, alongside a meaningful pullback in median pricing. Active listings rose to 540 (+9.5%) and months supply increased to 3.4 (+21.4%), while pending sales fell to 89 (-41.4%) and days active in MLS increased to 35 (+59.1%). The median sales price moved down to $1,390,000 (-11.1%), while closed sales increased to 123 (+4.2%) and closed volume rose to $443,066,284 (+3.6%).
Complete Market Statistics
Supply Metrics
Demand Metrics
Showing Activity
Pricing Metrics
Market Timing
What This Means for Sellers
Critical Challenges - Major Price Correction Underway
- Massive price drop - median sales price was $1,390,000 (-11.1%).
- Drastically slower market - days active in MLS increased to 35 (+59.1%).
- Buyer pullback - pending sales fell to 89 (-41.4%).
- Growing inventory - active listings rose to 540 (+9.5%) and months supply increased to 3.4 (+21.4%).
- Pricing concessions - percent of last list price was 97.7% (-2.0%) and percent of original price was 96.0% (-2.1%).
- Reduced seller activity - new listings were 265 (-8.6%).
Limited Opportunities
- Closed sales increased - closed sales were 123 (+4.2%).
- Transaction volume increased - closed volume was $443,066,284 (+3.6%).
- Market still moving - total closed sides were 246.0 (+4.2%).
Seller Strategy
- Pricing can be more sensitive with higher inventory (540 listings, +9.5%) and weaker pending demand (-41.4%).
- List-to-sale metrics indicate larger discounts than prior periods (97.7% of last list, -2.0%).
- Plan for longer marketing time (35 days, +59.1%).
- Shows-to-contract increased to 5.5 (+83.3%), suggesting more steps before an accepted offer.
- Condition and presentation can matter more when months supply rises (3.4, +21.4%).
What This Means for Buyers
Exceptional Opportunities - Best Buyer's Market In Years
- Median pricing moved down - $1,390,000 (-11.1%).
- More inventory to choose from - active listings were 540 (+9.5%).
- More time to decide - days active in MLS increased to 35 (+59.1%).
- Negotiation indicators improved - 97.7% of last list price (-2.0%) and 96.0% of original price (-2.1%).
- Supply moved closer to balanced - months supply increased to 3.4 (+21.4%).
Remaining Challenges
- Premium pricing remains - even with a decline, the median is $1,390,000.
- Completed activity increased - closed sales rose to 123 (+4.2%) and closed volume increased (+3.6%).
- Competition varies by listing - shows per listing was 3.3 (-10.8%).
Buyer Strategy
- Use longer market time (35 days, +59.1%) to compare options and evaluate pricing.
- List-to-sale metrics suggest more room to negotiate than earlier periods (97.7% of last list, -2.0%).
- Inventory expansion (540 active, +9.5%) can support more selectivity.
- Shows-to-contract increased to 5.5 (+83.3%), suggesting a longer search process.
- Focus on homes with longer market exposure if you are seeking more flexibility.
Market Outlook
February 2026 data in Irvine reflected higher supply and weaker pending demand alongside lower median pricing. Pending sales fell to 89 (-41.4%) while inventory increased (active listings 540, +9.5%; months supply 3.4, +21.4%). Marketing time increased to 35 days (+59.1%), and the median sales price was $1,390,000 (-11.1%). At the same time, closed sales increased to 123 (+4.2%) and closed volume rose to $443,066,284 (+3.6%), indicating transactions continued to close even as new pending activity weakened.
List-to-sale measures moved lower (97.7% of last list price, -2.0%; 96.0% of original price, -2.1%), consistent with more negotiation. Higher shows-to-contract (5.5, +83.3%) alongside lower shows per listing (3.3, -10.8%) suggests buyers may be more selective and outcomes may vary more by pricing, condition, and positioning.
Categories
Recent Posts