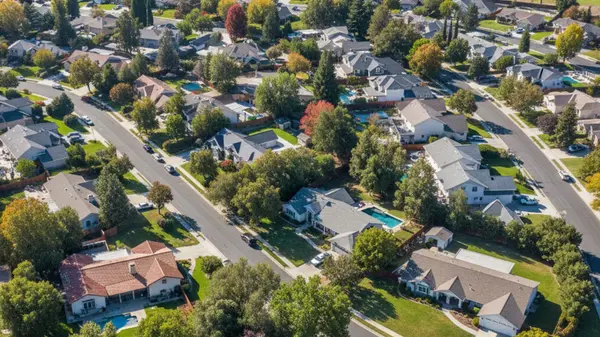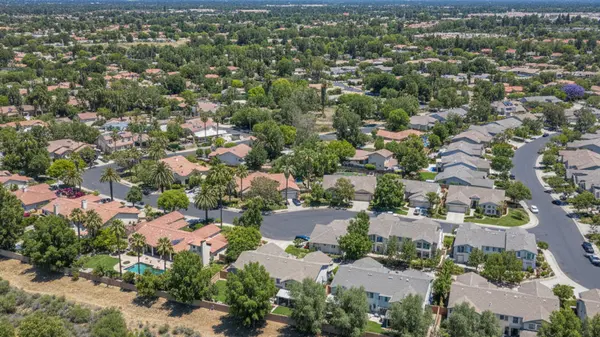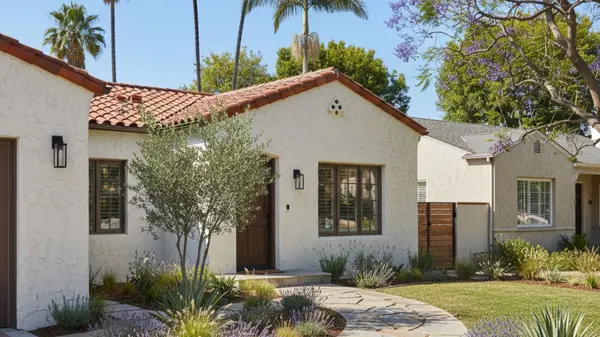
Newport Beach Market Update - February 2026
Newport Beach’s February 2026 market reflected elevated luxury pricing alongside weaker forward demand and longer timelines. The median sales price rose to $4,925,000 (+25.9%) and the average price climbed to $5,822,026 (+41.1%), while pending sales declined to 25 (-52.8%). Inventory contracted with 210 active listings (-13.2%) and 3.8 months supply (-15.6%), while days active in MLS increased to 50 (+47.1%). Closed volume rose to $454,118,000 (+72.0%).
Complete Market Statistics
Supply Metrics
Demand Metrics
Showing Activity
Pricing Metrics
Market Timing
What This Means for Sellers
Extraordinary Opportunities - Ultra-Luxury Boom
- Massive price appreciation - median up 25.9% to $4,925,000, average up 41.1% to $5,822,026.
- Record transaction volume - closed volume up 72.0% to $454,118,000.
- Sales increased - closed sales up 21.9% to 39.
- Showing activity rose - shows to contract up 200.0% to 3.0, shows per listing up 58.3% to 1.9.
- Luxury pricing remained elevated - pricing metrics rose even as inventory declined.
Challenges
- Supply declined - new listings down 40.1% to 97.
- Pending activity fell - pending sales down 52.8% to 25.
- Longer marketing time - days active in MLS up 47.1% to 50.
- Price concessions - 95.9% of last list price (-0.8%) and 94.1% of original price (-1.5%).
- Inventory remained lower - active listings down 13.2% to 210.
Seller Strategy
- Price to current luxury market levels, using recent closed activity as the anchor (closed sales 39, +21.9%).
- Plan for longer timelines (50 days, +47.1%) and expect negotiation consistent with list-to-sale metrics (95.9% of last list price).
- With fewer new listings (97, -40.1%), positioning and presentation can matter more as buyers become selective.
- Showing patterns suggest fewer in-person steps per contract than many markets (shows to contract 3.0), even with increases from the prior period.
- Monitor pending trends (25, -52.8%) closely, as they can signal shifts in near-term demand.
What This Means for Buyers
Critical Challenges - Extreme Luxury Pricing
- Higher pricing - median $4,925,000 (+25.9%) and average $5,822,026 (+41.1%).
- Higher price per square foot - $1,643 (+17.0%).
- Limited new supply - new listings 97 (-40.1%) and active listings 210 (-13.2%).
- Longer timeline signal - 50 days on market (+47.1%) indicates more measured decision-making.
- More viewing activity - shows per listing 1.9 (+58.3%), suggesting buyers are scrutinizing options closely.
Opportunities
- Negotiation indicators - 95.9% of last list price (-0.8%) and 94.1% of original price (-1.5%).
- Less pending competition - pending sales down 52.8% to 25.
- More time to decide - 50 days active in MLS (+47.1%).
- Supply still below balanced - 3.8 months supply (-15.6%) remains under the 6-month benchmark for balance.
- Motivated sellers on some listings - discounts from original pricing can reflect willingness to negotiate on certain homes.
Buyer Strategy
- Use longer timelines (50 days, +47.1%) to evaluate pricing, condition, and comparables carefully.
- List-to-sale metrics suggest negotiating may be more common than in tighter periods (95.9% of last list price; 94.1% of original price).
- Prioritize listings with longer market exposure, where sellers may be more flexible.
- Expect fewer total showings before a contract in this period (shows to contract 3.0), but be selective given the elevated price levels.
- Track pending trends (25, -52.8%) as a leading signal for near-term market direction.
Market Outlook
Newport Beach’s February 2026 data showed elevated luxury pricing alongside reduced pending activity and longer marketing times. The median price rose to $4,925,000 (+25.9%) while pending sales fell to 25 (-52.8%) and days active in MLS increased to 50 (+47.1%). Inventory measures declined (active listings 210, -13.2%; new listings 97, -40.1%), with months supply at 3.8 (-15.6%).
Closed metrics moved higher (closed sales 39, +21.9%; closed volume $454,118,000, +72.0%), indicating significant dollar volume closed even as forward demand softened. List-to-sale measures (95.9% of last list price and 94.1% of original price) suggest negotiation is present in this period, and outcomes may vary more by pricing, positioning, and buyer sensitivity at higher price points.
Categories
Recent Posts